
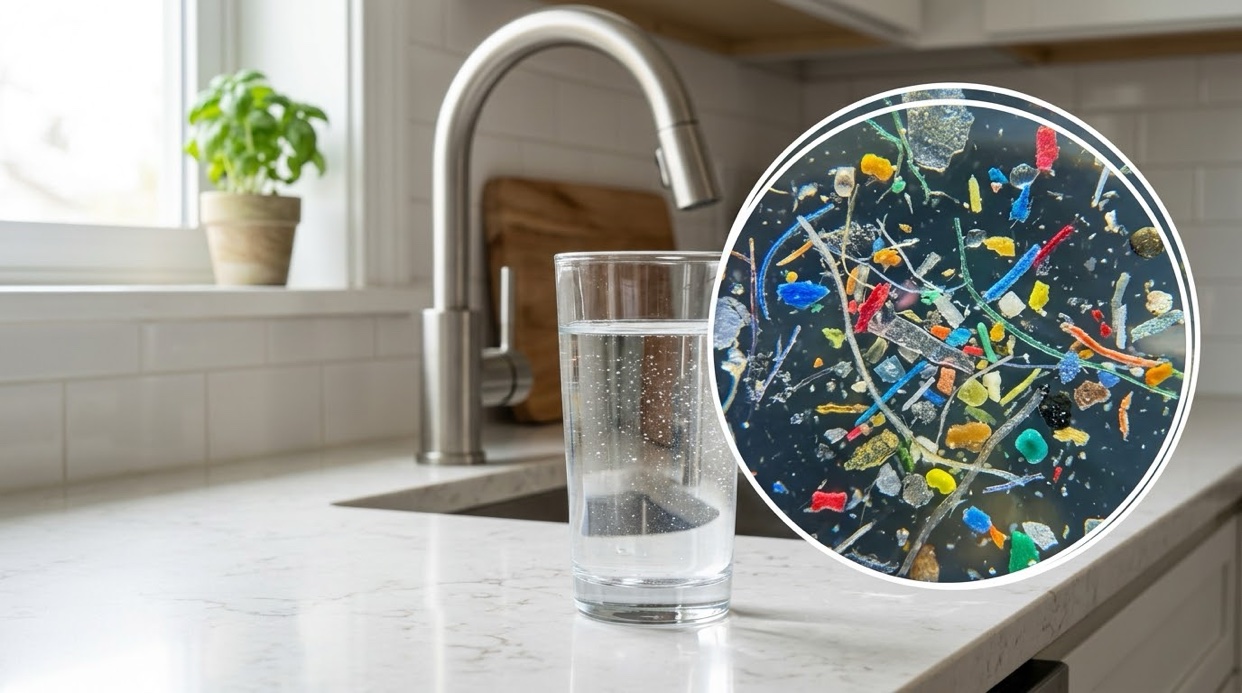
Microplastics have transitioned from a niche topic in marine biology to a primary concern for homeowners evaluating their tap water quality. As testing techniques grow more sensitive, scientists are detecting microscopic plastic particles in tap water, bottled water, rivers, and even inside the human body.
While headlines can sound alarming, the scientific understanding of human health risks is still evolving. This article provides a clear, factual breakdown of what microplastics are, where they originate, what research shows about their presence in drinking water, and how water filtration systems perform against them.
1. What Are Microplastics and Nanoplastics?
Plastic does not readily biodegrade; instead, environmental exposure to sunlight, wind, and wave action breaks it down into progressively smaller fragments. Plastic contaminants in water are generally classified into two primary size categories:
- Microplastics: synthetic solid plastic particles ranging from 1 micrometer (µm) up to 5 millimeters (mm) in size (about the size of a pencil eraser).
- Nanoplastics: plastic particles smaller than 1 micrometer (under 1,000 nanometers). Because of their sub-micron scale, nanoplastics are invisible under standard optical microscopes and require advanced chemical imaging technology to detect.
Primary Sources of Contamination
Microplastics enter the water supply through several everyday human activities and industrial processes:
- Synthetic Clothing Fibers: Washing synthetic garments (such as polyester, nylon, or acrylic fleece) sheds thousands of microfibers per laundry load. Wastewater treatment facilities capture many, but not all, of these fibers before effluent is discharged into waterways.
- Tire Wear and Road Runoff: Friction between vehicle tires (made of synthetic rubber compounds) and road surfaces generates tiny rubber-plastic particles. Rain washes this debris into storm drains and local surface waters.
- Degraded Plastic Waste: Single-use plastic packaging, bags, and bottles left in landfills or rivers slowly break down into fragments and microfibers over time.
- Cosmetics Microbeads: Historically added as exfoliants in facial scrubs and toothpaste, polyethylene microbeads washed down household drains. Although federal law banned intentionally added microbeads in wash-off cosmetics via the Microbead-Free Waters Act of 2015, older residues persist in environmental sediments.
2. What Studies Have Found in Drinking Water
As scientific instrumentation has advanced, researchers have shifted from studying ocean waters to testing tap and bottled water directly.
- Tap Water Contamination (Kosuth et al., 2018): In a global study published in PLOS ONE, researchers tested 159 tap water samples from around the world. The study found that 81% of tap water samples contained anthropogenic particles — nearly all of them fibers — with an average concentration of 5.45 particles per liter.
- Bottled Water Microplastics (Mason et al., 2018): A groundbreaking study by researchers at the State University of New York at Fredonia analyzed 259 individual bottles of water across 11 global brands (published in Frontiers in Chemistry). The team detected plastic particles in 93% of the tested bottles, averaging 325 particles per liter (including particles down to 6.5 µm). Polypropylene, the polymer frequently used to manufacture bottle caps, accounted for 54% of the identified particles, suggesting the packaging process itself contributes contamination.
- Bottled Water Nanoplastics (Qian et al., 2024): Utilizing single-particle Stimulated Raman Scattering (SRS) microscopy, researchers from Columbia and Rutgers Universities published a landmark study in PNAS. They found that bottled water contained an average of ~240,000 plastic particles per liter — roughly 90% of which were nanoplastics under 1 micrometer in size, which earlier analytical methods were unable to count. (That headline count has since drawn a published critique over laboratory blank methods, which the authors have answered; the exact number is debated, but the finding that bottled water carries far more plastic particles than tap water is not.)
3. Potential Health Effects: What Science Knows (and Does Not Know)
Understanding how microplastics affect human health requires distinguishing between detection and toxicity. Scientists have confirmed where particles go, but long-term health consequences remain an active field of study.
Where Particles Have Been Detected in the Body
Peer-reviewed studies have detected microplastics and nanoplastics in human blood, lung tissue, placenta tissue, and stool samples. Recent autopsy studies have also detected particles in cardiovascular tissue and human brain tissue samples.
The Current Scientific Consensus
- Biological Absorption: Larger microplastics (above roughly 150 micrometers) are generally not absorbed by the human gastrointestinal tract and pass through the body. However, smaller particles — particularly sub-micron nanoplastics — possess the theoretical capability to cross biological membranes, such as the gut lining or blood-brain barrier.
- Toxicity Concerns: Researchers are actively investigating two main areas of concern: cellular toxicity caused by physical particle irritation, and chemical exposure from plastic additives (such as phthalates or bisphenols) leaching into tissues.
- Current Status: In its public health evaluations, the World Health Organization (WHO) concluded that while routine monitoring is sensible, the current scientific evidence does not show a clear, quantified health risk from consuming microplastics at current levels in drinking water. Health institutions emphasize that more standardized research is required before firm conclusions can be drawn.
4. Regulatory Status: EPA Standards and Regulations
To evaluate your drinking water accurately, it is essential to understand federal and state regulatory frameworks.
Is there an EPA Maximum Contaminant Level (MCL) for microplastics?
No. There is currently no enforceable EPA drinking water standard or Maximum Contaminant Level (MCL) for microplastics or nanoplastics under the Safe Drinking Water Act. Public water utilities are not legally required to test for or report microplastic concentrations.
Regulatory Outlook:
The EPA has included microplastics on its draft Contaminant Candidate List 6 (CCL 6), published in April 2026. The CCL is a watchlist of unregulated contaminants known or anticipated to occur in public water systems. Inclusion on this list prioritizes federal research into standardized testing methodologies, occurrence, and toxicology, which represents the initial administrative step toward potential future regulation. Microplastics are often discussed alongside PFAS — the forever chemicals — as the two emerging contaminant stories in drinking water; you can read our full breakdown in PFAS in Drinking Water.
5. Particle Sizes vs. Filter Micron Ratings
Selecting the right water filter requires comparing particle dimensions against filter pore sizes. Particle dimensions are measured in micrometers (µm), commonly called microns (1 micron = 0.001 millimeters).
Size Reference Scale
- Human Hair Diameter: ~70 µm
- Fine Beach Sand: ~100 µm
- Microplastics: 1 µm to 5,000 µm (5 mm)
- Nanoplastics: under 1 µm (under 1,000 nanometers)
Absolute vs. Nominal Micron Ratings
When shopping for water treatment filters, understanding the difference between rating types is critical:
- Nominal Micron Rating: Per the Water Quality Association (WQA), a nominal rating means the filter traps about 85% of particles at the specified size. A 1-micron nominal filter still lets roughly 15% of 1-micron particles pass through.
- Absolute Micron Rating: Represents a verified physical barrier where the filter rejects 99.9% or more of particles at or above that specified micron size under laboratory test conditions.
6. What Removes Microplastics: Filter Types and Pore Sizes
Water treatment technologies vary in their ability to capture microplastics based on physical pore size and filtration mechanics.
Sediment Filters
Typical Pore Size / Rating: 1 µm to 50 µm
Microplastic Removal Capability: Moderate to High (traps larger fragments and synthetic fibers)
Nanoplastic Removal Capability: None (nanoplastics pass straight through)
Carbon Block Filters
Typical Pore Size / Rating: 0.5 µm to 10 µm
Microplastic Removal Capability: High (captures most microplastics 0.5 µm and larger via physical straining and adsorption)
Nanoplastic Removal Capability: Low to None (sub-micron particles bypass carbon pores)
Reverse Osmosis (RO)
Typical Pore Size / Rating: ~0.0001 µm
Microplastic Removal Capability: Very High (~99%+ physical rejection)
Nanoplastic Removal Capability: High (rejects sub-micron particles down to ionic levels)
Important Note on Certifications
There is no standalone standard written only for microplastics — but that does not mean no certification exists. Microplastics Reduction is a certified claim under NSF/ANSI 401, the standard for emerging compounds, and real products carry it today, certified by NSF and by IAPMO R and T. When you shop, that claim — Microplastics Reduction under NSF/ANSI 401 — is the one to look for, and you can confirm any product listing in the certifier own directory before you buy.
The size-based claim still matters too: Particulate Reduction, Class I, under NSF/ANSI 42 covers particles of 0.5 to 1 µm (at least 85% reduction) — rust-and-sediment territory originally, but the same physical size range as larger microplastics. Be wary of any brand advertising a special microplastic certified logo outside these standards; check the claim against the NSF/ANSI 401 listing instead.
7. Regional Findings: Microplastics in New Jersey Waterways
Local research in New Jersey highlights how microplastics move through state water infrastructure and natural surface waters.
- NJ DEP Wastewater and Surface Water Analysis (2026): A May 2026 study published by the New Jersey Department of Environmental Protection (NJ DEP) Division of Science and Research, with Rutgers University researchers, evaluated microplastic concentrations across four municipal Wastewater Treatment Plants (WWTPs) and receiving water bodies.
- Findings: The study identified particles ranging in size from 140 µm to 5,000 µm in wastewater. Influent entering the plants averaged 33 microplastic particles per liter, and the plants removed 84–93% of microplastics by the end of treatment, with treated effluent averaging about 1.4 particles per liter. Nearby surface waters averaged between 1.0 (upstream) and 1.5 (downstream) microplastic particles per liter, showing that treated discharge and stormwater runoff continually introduce synthetic polymers into New Jersey rivers and watershed systems; the most common polymers identified in the wastewater itself were polypropylene (35%) and polyester (23%).
Summary and Practical Takeaways
- Tap water contains significantly fewer microplastic particles than bottled water. Bottled water packaging sheds substantial quantities of micro- and nanoplastics into the liquid.
- Reverse Osmosis (RO) and sub-micron Carbon Block filters (0.5 µm absolute) are the most effective home filtration methods for capturing microscopic plastic debris.
- A microplastics certification does exist — look for a Microplastics Reduction claim under NSF/ANSI 401, verified in the certifier directory, or a certified Class I particulate reduction (0.5–1 µm) under NSF/ANSI 42, or an RO system, for the strongest documented performance.
Leave a Reply